Plot Groups with Connected Components Colored
Usage
geo_plot_group(shp, adj, group, save = FALSE, path = "")
Arguments
- shp
An sf object.
- adj
Adjacency list.
- group
Optional vector of group identifiers, typically district numbers
or county names.
- save
Logical. If TRUE, save each plot to disk.
- path
Directory prefix used when save = TRUE.
Value
list of ggplot objects, one per unique group
Examples
library(dplyr)
data('checkerboard')
data('checkerboard_adj')
checkerboard <- checkerboard |> mutate(discont = as.integer(j == 5 | j == 6))
p <- geo_plot_group(checkerboard, checkerboard_adj, checkerboard$discont)
p[[1]]
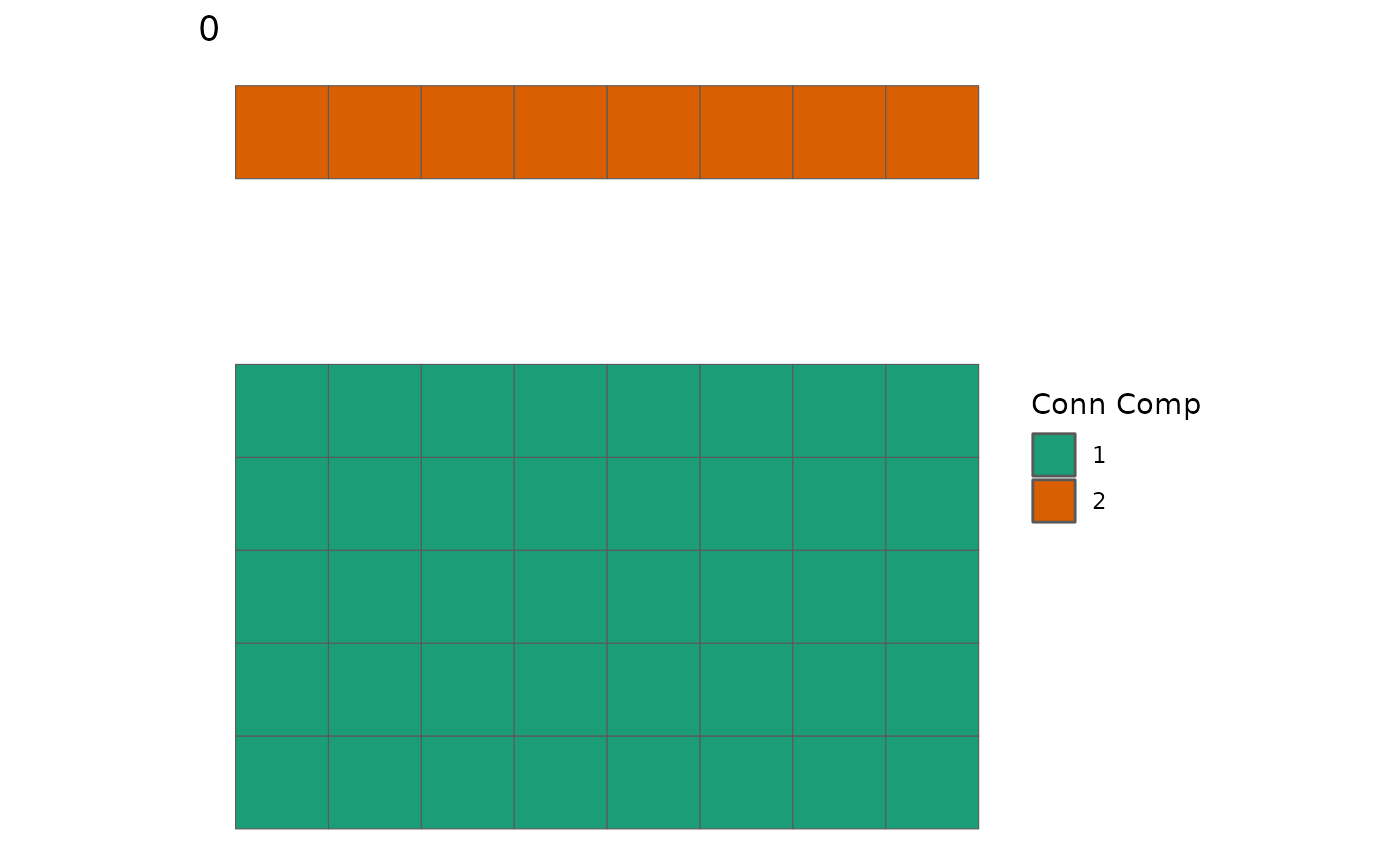 p[[2]]