Usage
plot_palette(x, use_names = TRUE, use_ggplot = TRUE)
Arguments
- x
a palette
- use_names
Should the names of the palette be used as labels? Default: TRUE.
- use_ggplot
Should the plot be made with ggplot2 if available? Default: TRUE.
Value
A ggplot (if ggplot2 is available) or base plot of the palette
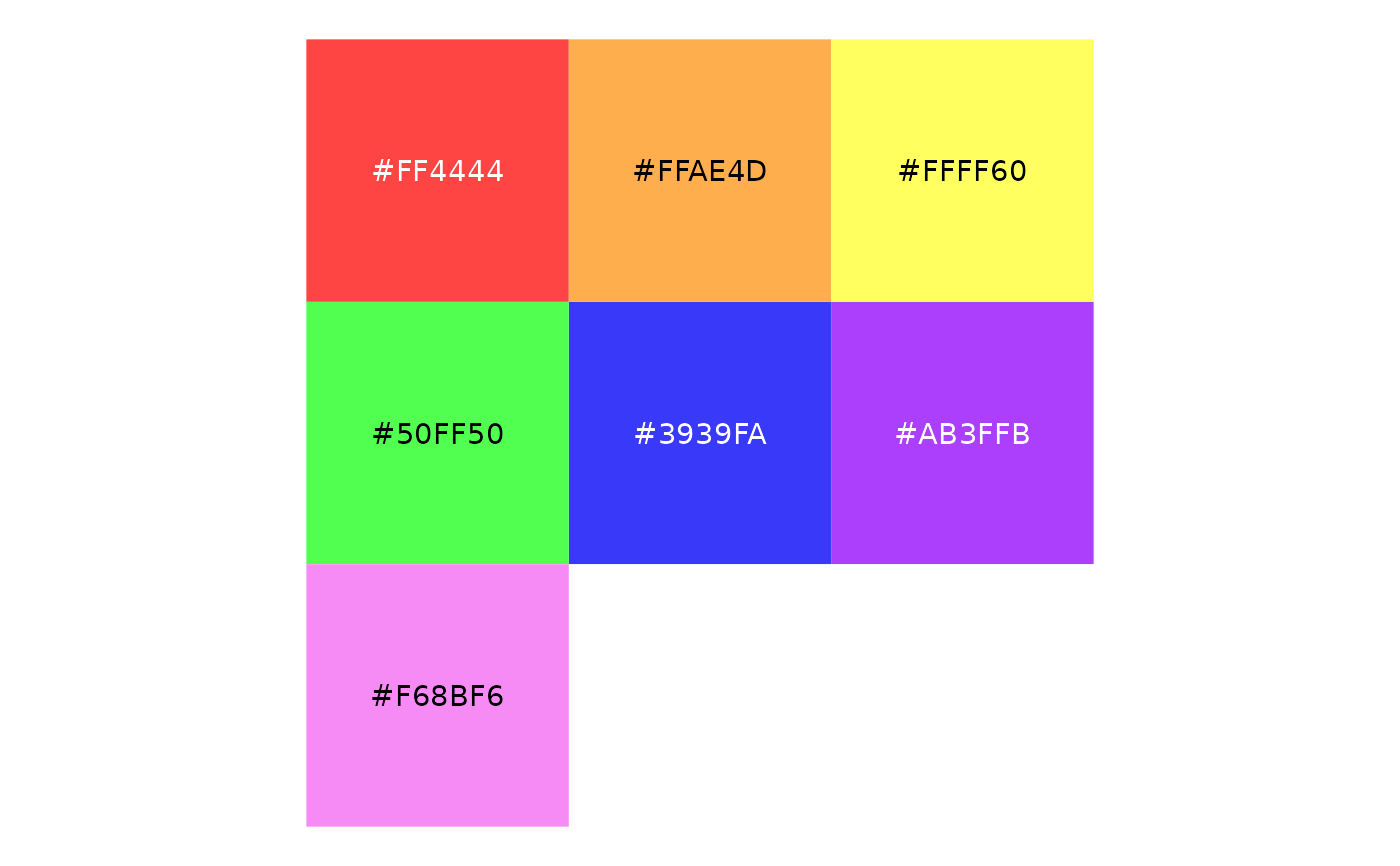
Examples
plot_palette(roygbiv)