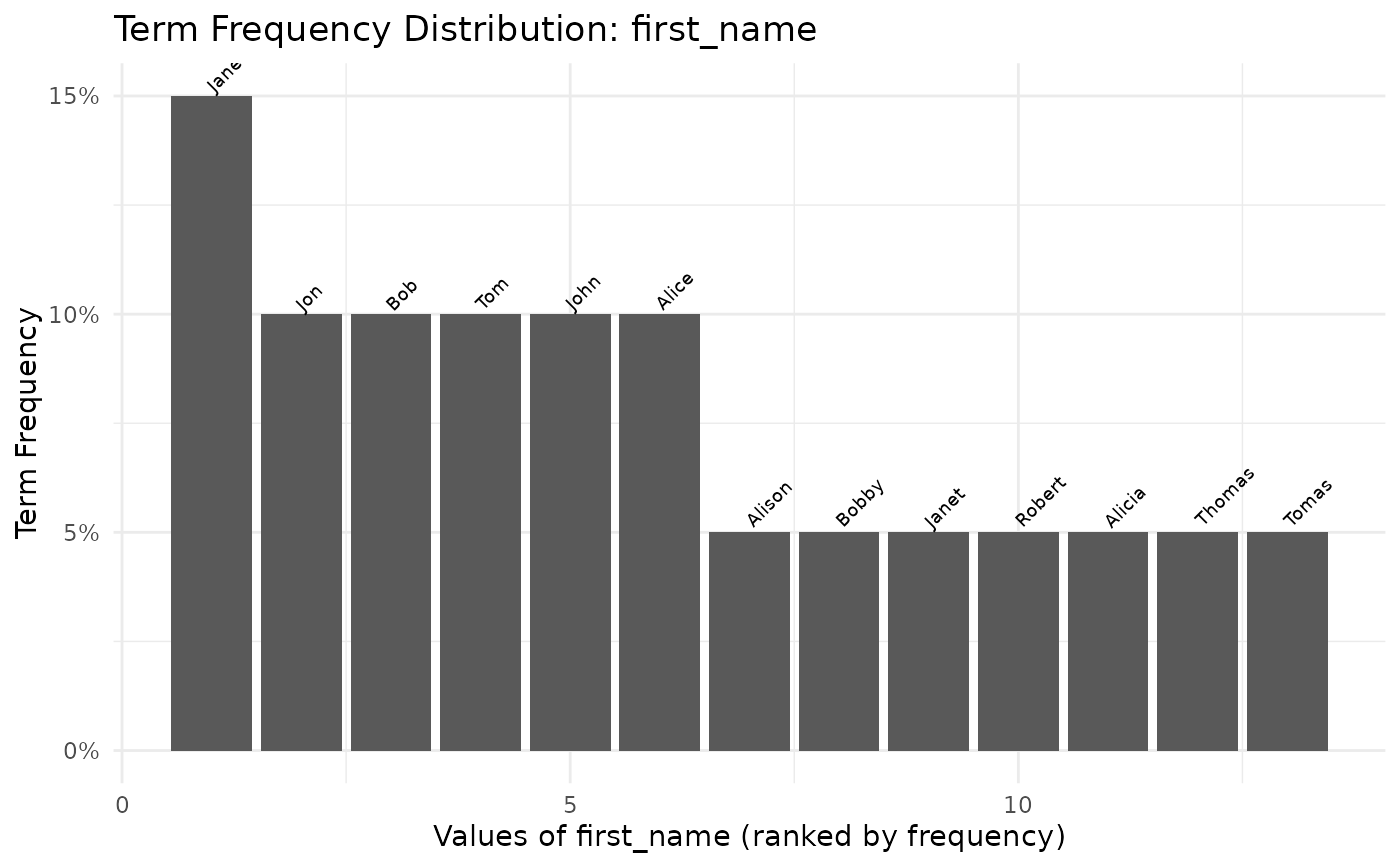
Visualizes the distribution of term frequencies for a column in the model. Shows how individual values shift the match weight via the TF adjustment. Rare values boost the weight, while common values penalize it.
Value
A ggplot2::ggplot() object.
Examples
con <- DBI::dbConnect(duckdb::duckdb())
spec <- il_spec() |>
  il_compare(first_name, cl_exact(term_frequency = TRUE))
model <- il_model(fake_20, spec = spec, con = con)
il_tf_chart(model, 'first_name')

il_cleanup(model)
DBI::dbDisconnect(con, shutdown = TRUE)
il_cleanup(model)
DBI::dbDisconnect(con, shutdown = TRUE)